Interactive Mode
With Golem the execution of a test can be paused at any point to start an interactive console with all the actions available. This is useful for debugging tests.
interactive_mode Action
To start the interactive console at any point of a test just add the interactive_mode action. Example:
test.py
def test(data):
    navigate('http://wikipedia.org/')
    interactive_mode()
    click(page.button)
    take_screenshot('final screenshot')
When the test reaches the second step, the interactive console is going to start:
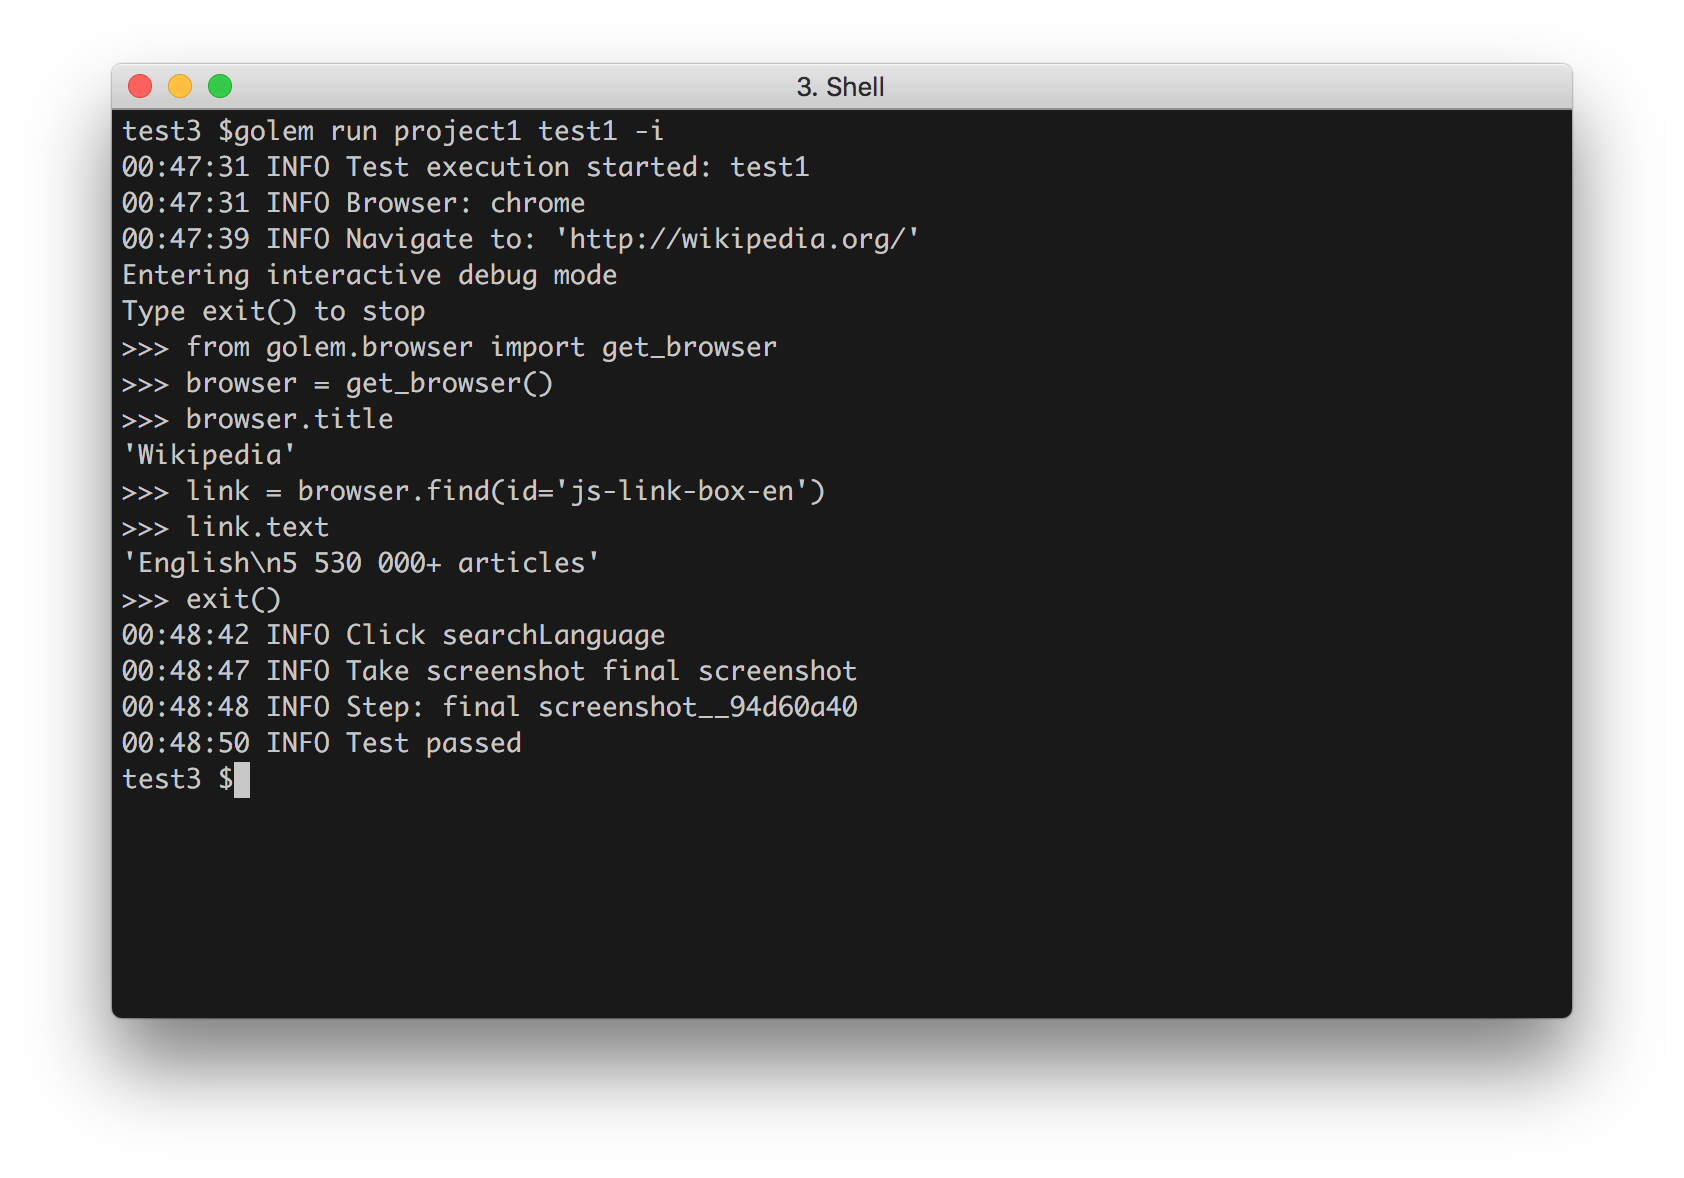 interactive-console
When the interactive console is terminated, the test will resume the execution from that point on.
Note
If the test is not run with the -i flag, the interactive_mode action will be ignored
Quick Interactive Mode
It is possible to start a quick interactive shell by not providing a project and test to the run command:
golem run -i
This will start an interactive console with a clean slate.
>golem run -i
Entering interactive mode
type exit() to stop
type help() for more info
>>> navigate('https://en.wikipedia.org')
12:47:54 INFO Navigate to: 'https://en.wikipedia.org'
>>> send_keys('#searchInput', 'automation')
12:48:58 INFO Write 'automation' in element #searchInput
>>> click('#searchButton')
12:49:18 INFO Click #searchButton
>>> get_browser().title
'Automation - Wikipedia'
>>> assert_title_contains('Automation')
12:49:50 INFO Assert page title contains 'Automation'
Python Debugger
It is possible to add a Python debugger breakpoint (pdb.set_trace()) using the set_trace action. As with the interactive_mode, the test must be run with the -i flag for this action to take effect. More info about pdb here.
Example:
test.py
def test(data):
    navigate('https://en.wikipedia.org')
    set_trace()
>golem run project test -i
12:57:11 INFO Test execution started: test
12:57:11 INFO Browser: chrome
12:57:11 INFO Navigate to: 'https://en.wikipedia.org'
--Return--
> c:\[...]\golem\actions.py(1578)set_trace()->None
-> pdb.set_trace()
(Pdb)